
Reference:
- An Introduction To Statistical Learning with Applications in R (ISLR Sixth Printing)
- https://godongyoung.github.io/category/ML.html
Why Not Linear Regression?
There is no natural way to convert a qualitative response varaible with more than two levels into a quantitative response that is ready for linear regression. Therefore, better use classification.
Logistict Regression
It models the probability that Y belongs to a particular category (All probabilities lie between 0 and 1).
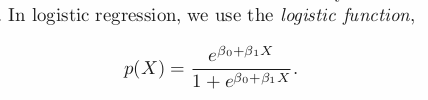
The function will always produce S-shaped curve, hence regardless of X, we will obtain a sensible prediction.
The fact that it is not a straight line between p(X) and X, and the rate of change of p(X) per unit change in X depends on the value of X, can be seen by the line.
Estimating the Regression Coefficients
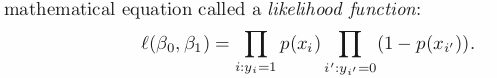
In case of Logistic Regression, MLE is suitable than Least Square to estimate coefficinets in case of non-linear models. Hence, Maximum Likelihood takes parameter b0 and b1 that makes below Likelihood function max.
z-stat : hat(b1)/SE(hat(b1)) —> large (absolute) value indicates evidence against the null hypothesis: b1 = 0 in p(x) although still use p for hypothesis test.
For multiple predictors more than two, Linear Discriminant Analysis is better.
Usually good under parameter ≤ 2
Linear Discriminant Analysis
Esitmation through the distribution of Xs. P(X|Y) through Bayes.
- When the classes are well-separated, the parameter estimates for the logistic regression model are unstable; LDA does not have this.
- If n is small and predictors X approx norms in distribution, LDA is more stable.
- LDA is more popular when having more than two response.
Bayes’s Theorem for Classification.
To classify into one of K classes (K ≥ 2); meaning Y can take K possible distinct and unordered values.
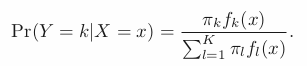
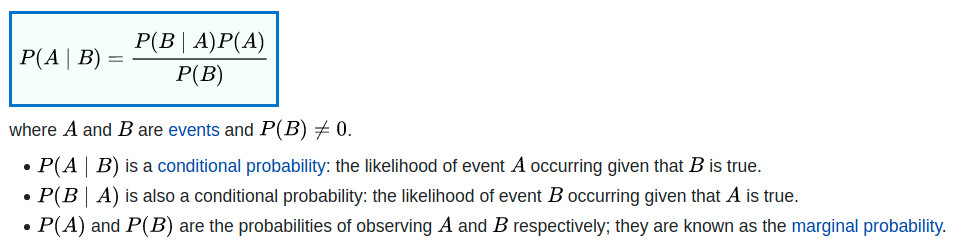
Posterior Likelihood = Prior Likelihood * density function/ …
If we can estimate Posterior Likelihood corrcetly, ideal classifcation that has low error con be made.
Esitmating posterior likelihood is hard, so need to assume particular distribution for density function.
LDA for p = 1
Assumption: Normal/Gaussian Distribution; each different distribution exists among K (num of class) with its corresponding mean and shared variance.
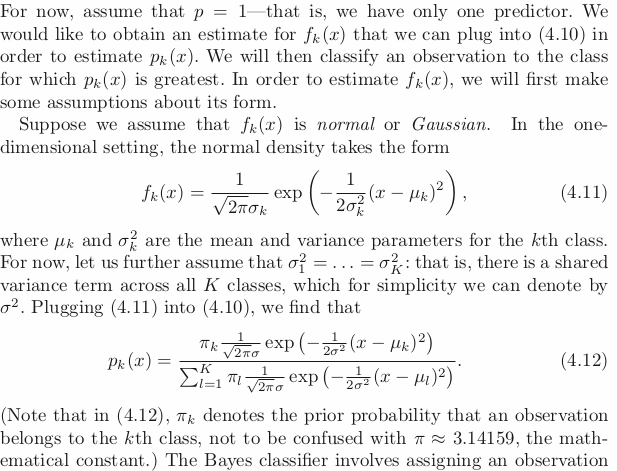
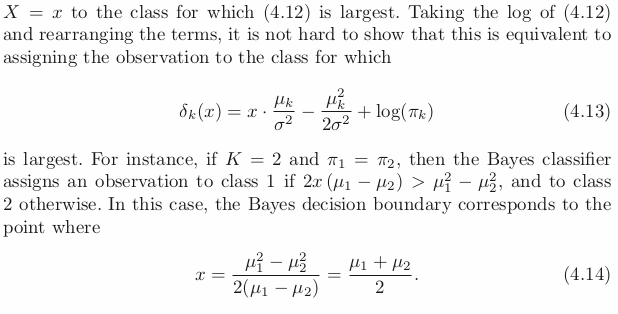
Use log for above equation and remove duplicated term that not changed to certain k —> giving you the largest class k! Since log is one to one func —> no info loss.
To implement LDA
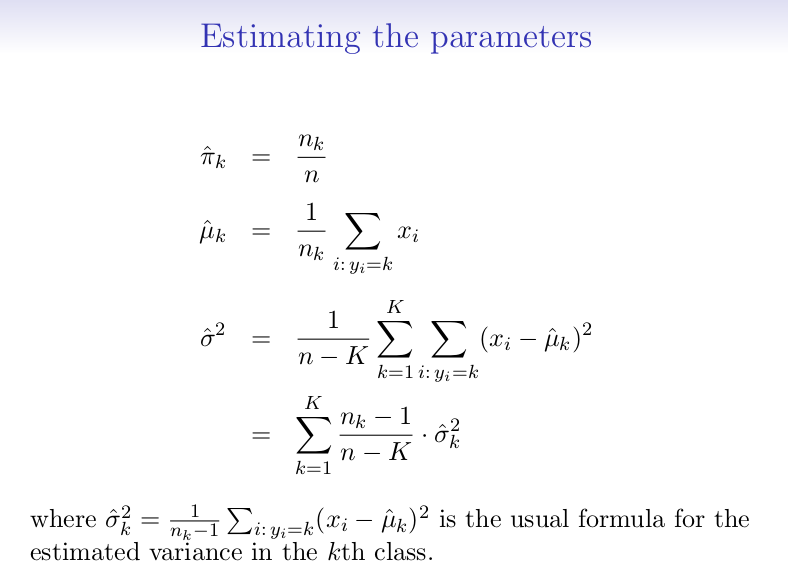
- Estimating the parameters
- Compute the decision boundary that results from assigning an observation to the class for which Var_k is the largest (above figure, bottom).
- Left, right of this dotted line represents each classes.
Comparing Bayes Error Rate and LDA error rate to see how the model does.
최종 정리하자면, LDA는 ‘ fk(x)=P(X=x|Y=k) 에 대한 정규 가정과 각 클래스마다 다른 평균, 동일한 분산’을 가정하여 Bayes classifier의 확률을 추정하는 방법이다. 뒷장에서 ‘등분산’에 대한 가정을 떼어내는(즉 클래스마다 σ2k를 가질 수 있게 하는) 방법을 배울 것이다.
출처:
[ISL] 4장 - 분류(로지스틱, LDA, QDA) 이해하기
LDA for p > 1
Assumption: Each multivariate Gaussian —> each class has diff mean, and still shares the same variance.
Multivariate Gaussian: each variable follow its Gaussian Distrib, and each variable pair has correlation —> can be seen as mulit-dimensional Gaussian Distrib.
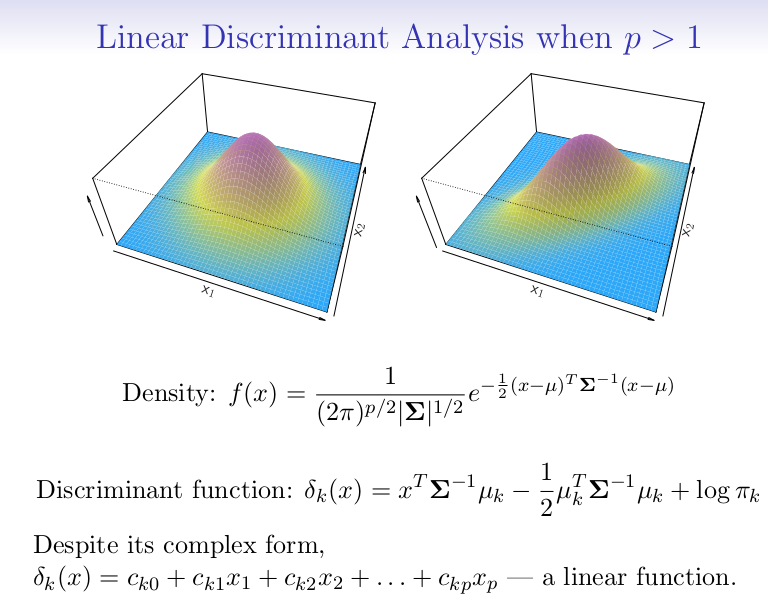
- Left: Two predictors are not correlated; meaning Xs’ variacne are the same, while correlation = 0.
- Use Bayes Equation gives the second equation above; choosing the largest K.
- Since it is still a linear to X, it is LDA.
Problem of Null Classifier
LDA has low on training error rate but
- It will usually lower than test error rates; meaning it may perform worse to predict a new data. Because specifically adjusted the parametrs of the model to do well on the training data. The higher ratio of parameters p to number of samples n, the more expect overfitting.
- The trivial null classifier will achieve an error rate that is only a bit higher than the LDA training set error rate.
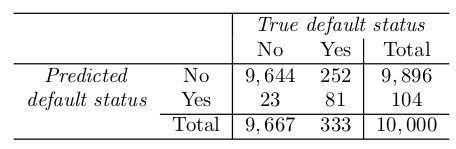
Confusion Matrix can identify the binary classifier error (putting into different category).
Sensitivity : if the targeted class well measured.
Specificty: if the non-targeted class well measured.
Why does LDA do such a poor job of classifying the customers who default? In other words, why does it have such a low sensitivity?
- LDA is trying to approximate the Bayes classifier, which has the low est total error rate out of all classifiers (if the Gaussian model is correct).
- The Bayes classifier will yield the smallest possible total number of misclassified observations, irrespective of which class the errors come from.
- Meaning if classify as non-default will be likely correct in this case, the model be considerate at classify the data as default.
- In this case, using lower threshold could be a solution.
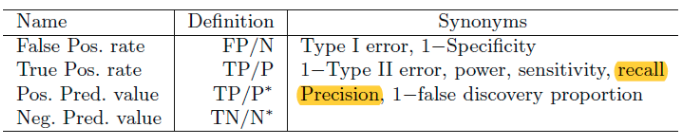
Recall: TP/P - 재현율 (진짜 애들중 몇명) Precision: TP/P* - 정확률 (잡은 애들중 진짜가 몇명).
Quadratic Discriminant Analysis
Unlike LDA, each class has its own covariance matrix in QDA. Still use multivariate nomal distrib and use Bayes theorem.
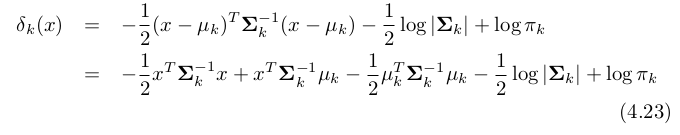
This function is not linear to X, hence called QDA —> therefore decision boundary is non-linear as well.
- For LDA, cov matrix = p(p+1)/2 hence it is less flexible and low variance model. However it will have high bias if it is not nomally distributed (which is in most real cases). If less variance is more important because of small training data, use LDA.
- For QDA, cov matrix = Kp(p+1)/2. If large training data (so less concern with variance) exists, or covariance seems unrealistic (not normally distributed) use QDA.
Comparison of Classification Methods.
LDA and Logit
- Both creates decision boundary although use diff calculations.
- If it is close to normal distribution, LDA is better. If not, Logit.
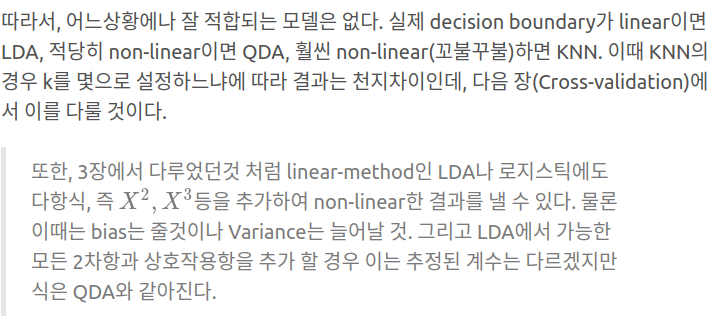
KNN
- If decision bondary is non-linear, it would be good.
- It will not be good for intepretation for which variable played an important rule —> Since the purpose of this method is to analyze the data status.
QDA
- KNN+LDA+Logit characteristics.
- Less flexible than KNN, but decision boundary is Non-linear
- Hence it is more flexible than LDA.
- Due to the assumption of distribution, it will more fit in small data unlike KNN. (Ofc needs more data than LDA as it has more parameters).
Case Experiment:
- Diff mean, Uncorrelated, Normal Distribution
- LDA did the best due to the distribution.
- KNN and QDA are too flexible for distribution so bias (strength it has) did not show off much, and has higher variance —> did not do well.
- Logit is slightly worse than LDA since the boundary decision is linear.
- Diff mean, correlation : -0.5, Normal Distribution
- It means multivariate normal distribution
- Same as 1.
- t-distribution
- Since assumption of LDA is violated, Logit > LDA > KNN, QDA
- It is because it is still similar to Normal Distribution.
- First class : 0.5 corr with normal dist, Second class: -0.5 corr with normal dist.
- Satisfies QDA assumption, hence QDA was the best.
- 2-Polynomial Decision boundary
- QDA then KNN-cv
- More non linear than 5th one
- KNN-cv > QDA > LDA,Logit > KNN-1
- It states k does matter as 1 is too flexible.
출처: https://godongyoung.github.io/머신러닝/2018/01/23/ISL-Classification_ch4.html